menu-iconExamlexExamLexServices

Discover

Ask a Question
  1. All Topics
  2. Topic
    Statistics
  3. Study Set
    Basic Business Statistics
  4. Exam
    Exam 2: Organizing and Visualizing Data
  5. Question
    Given Below Is the Scatter Plot of the Market Value
Solved

Given Below Is the Scatter Plot of the Market Value

Question 12

Question 12

True/False

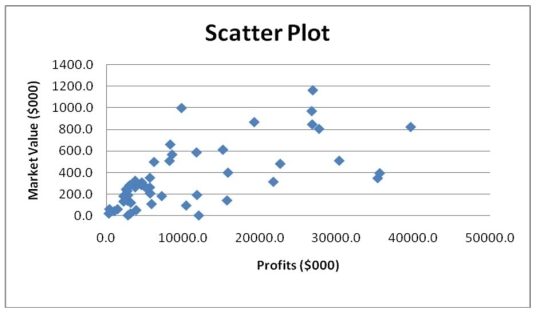
Given below is the scatter plot of the market value (thousands$) and profit (thousands$) of 50 U.S. companies. Higher market values appear to be associated with higher profits.

Correct Answer:

verifed

Verified

Unlock this answer now
Get Access to more Verified Answers free of charge

Related Questions

Q7: TABLE 2-14<br>The table below contains the number

Q8: TABLE 2-16<br>The figure below is the percentage

Q9: TABLE 2-7<br>The Stem-and-Leaf display below contains data

Q10: TABLE 2-7<br>The Stem-and-Leaf display below contains data

Q13: Apple Computer, Inc. collected information on the

Q14: In general,grouped frequency distributions should have between

Q14: TABLE 2-9<br>The frequency distribution below represents the

Q15: TABLE 2-18<br>The stem-and-leaf display below shows the

Q17: TABLE 2-14<br>The table below contains the number

Q43: The stem-and-leaf display is often superior to

Examlex

ExamLex

About UsContact UsPerks CenterHomeschoolingTest Prep

Work With Us

Campus RepresentativeInfluencers

Links

FaqPricingChrome Extension

Download The App

Get App StoreGet Google Play

Policies

Privacy PolicyTerms of ServiceHonor CodeCommunity Guidelines

Scan To Download

qr-code

Copyright © (2025) ExamLex LLC.

Privacy PolicyTerms Of ServiceHonor CodeCommunity Guidelines