Short Answer
TABLE 17-8
Recently, a university switched to a new type of computer-based registration. The registrar is concerned with the amount of time students are spending on the computer registering under the new system. She decides to randomly select 8 students on each of the 12 days of the registration and determine the time each spends on the computer registering. The range, mean, and standard deviation of the times required to register are in the table that follows. 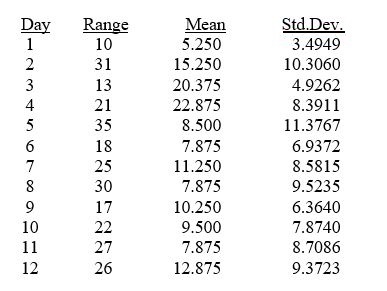
-Referring to Table 17-8, an
 chart is to be used for the time required to register. One way to obtain the control limits is to take the grand mean and add and subtract the product of A₂ times the mean of the sample ranges. For this data set, the value of A₂ is ________.
Correct Answer:

Verified
Correct Answer:
Verified
Q79: TABLE 17-7<br>A supplier of silicone sheets for
Q80: TABLE 17-3<br>A quality control analyst for a
Q81: TABLE 17-1<br>A local newspaper has 10 delivery
Q82: Which of the following is not one
Q83: TABLE 17-9<br>The manufacturer of canned food constructed
Q85: Larger Cpk indicates larger capability of meeting
Q86: TABLE 17-3<br>A quality control analyst for a
Q88: TABLE 17-9<br>The manufacturer of canned food constructed
Q89: Referring to Table 17-7, what percentage of
Q118: An in-control process must be achieved before