Short Answer
Which of the following cumulative distribution graphs would most likely represent the total annual sales of milk?
I. 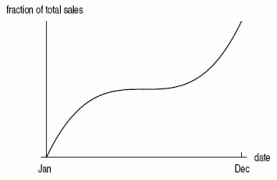 II.
II. 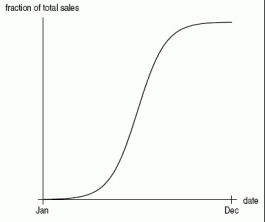 III.
III. 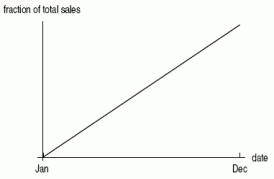
Correct Answer:

Verified
Correct Answer:
Verified
Related Questions
Q46: The annual rainfall for a desert city
Q47: The probability of a plant surviving t
Q48: A professor far away from here gives
Q49: Let <img src="https://d2lvgg3v3hfg70.cloudfront.net/TB8190/.jpg" alt="Let be
Q50: The density function for the height of
Q52: According to data from 2007, the height
Q53: The following figure gives the density function
Q54: Which of the following functions makes the
Q55: The cumulative distribution function for the time
Q56: The following figure shows the distribution of