Multiple Choice
The following figure gives the density function for the velocities of cars passing a checkpoint on a freeway.Which were cars more likely to be driving? 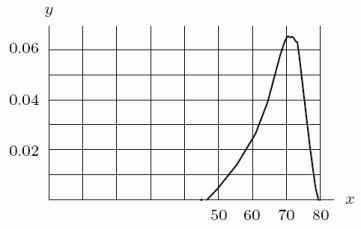
A) Between 55 and 65 mph
B) Between 70 and 80 mph
Correct Answer:

Verified
Correct Answer:
Verified
Related Questions
Q48: A professor far away from here gives
Q49: Let <img src="https://d2lvgg3v3hfg70.cloudfront.net/TB8190/.jpg" alt="Let be
Q50: The density function for the height of
Q51: Which of the following cumulative distribution graphs
Q52: According to data from 2007, the height
Q54: Which of the following functions makes the
Q55: The cumulative distribution function for the time
Q56: The following figure shows the distribution of
Q57: The probability of waiting no more than
Q58: The cumulative distribution function in the second