Multiple Choice
The following figure shows the distribution of the number of hours of television viewed per day by a group of children. Estimate the percent of the children who watched less than 3 hours per day. 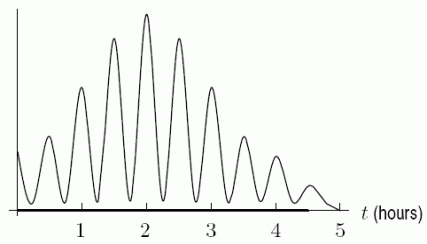
A) 65%
B) 95%
C) 50%
D) 80%
Correct Answer:

Verified
Correct Answer:
Verified
Q51: Which of the following cumulative distribution graphs
Q52: According to data from 2007, the height
Q53: The following figure gives the density function
Q54: Which of the following functions makes the
Q55: The cumulative distribution function for the time
Q57: The probability of waiting no more than
Q58: The cumulative distribution function in the second
Q59: Suppose <img src="https://d2lvgg3v3hfg70.cloudfront.net/TB8190/.jpg" alt="Suppose is
Q60: The following figure shows a density function
Q61: A banana plant typically has about 40