Multiple Choice
Cost and revenue functions are graphed in the first figure. What does the second figure show? 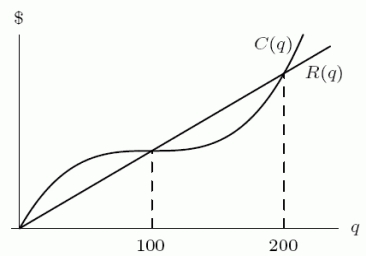
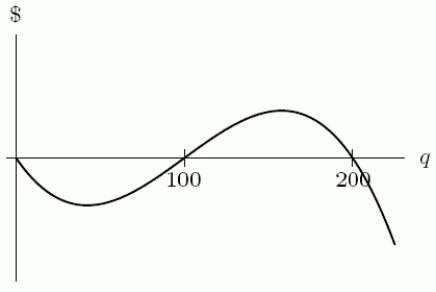
A) Total profit
B) Marginal cost
C) Marginal revenue
Correct Answer:

Verified
Correct Answer:
Verified
Related Questions
Q118: Using a calculator, estimate the derivative of
Q119: Consider the two functions shown below. A.
Q120: Cost and revenue functions for a certain
Q121: To study traffic flow along a major
Q122: The following table gives the cost and
Q124: Estimate <img src="https://d2lvgg3v3hfg70.cloudfront.net/TB8190/.jpg" alt="Estimate when
Q125: An amount of $500 was invested in
Q126: Given the following data about the function
Q127: The graph below is the graph of
Q128: The growth graph in the following figure