Short Answer
An amount of $500 was invested in 1970 and the investment grew as shown in the following table. (Amounts are given for the beginning of the year.) The average rate of increase of the investment between 1980 and 1990 is _____ per year. 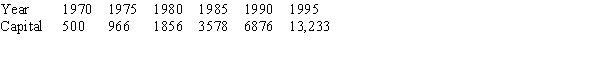
Correct Answer:

Verified
Correct Answer:
Verified
Q120: Cost and revenue functions for a certain
Q121: To study traffic flow along a major
Q122: The following table gives the cost and
Q123: Cost and revenue functions are graphed in
Q124: Estimate <img src="https://d2lvgg3v3hfg70.cloudfront.net/TB8190/.jpg" alt="Estimate when
Q126: Given the following data about the function
Q127: The graph below is the graph of
Q128: The growth graph in the following figure
Q129: Consider the following graph. In region III,
Q130: The noise level, N, in decibels, of