menu-iconExamlexExamLexServices

Discover

Ask a Question
  1. All Topics
  2. Topic
    Mathematics
  3. Study Set
    Applied Calculus
  4. Exam
    Exam 2: Rate of Change: the Derivative
  5. Question
    The Growth Graph in the Following Figure Shows the Height
Solved

The Growth Graph in the Following Figure Shows the Height

Question 128

Question 128

Short Answer

The growth graph in the following figure shows the height in inches of a bean plant during 30 days. On the 15th day, the plant was growing about _____ inches/day. Round to 2 decimal places.
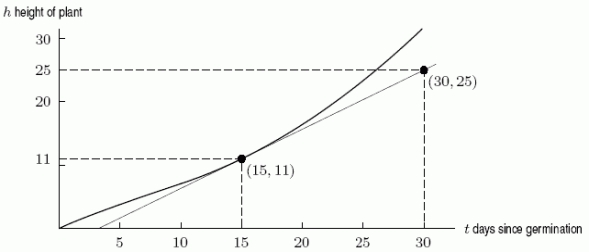
 The growth graph in the following figure shows the height in inches of a bean plant during 30 days. On the 15<sup>th</sup> day, the plant was growing about _____ inches/day. Round to 2 decimal places.

Correct Answer:

verifed

Verified

Unlock this answer now
Get Access to more Verified Answers free of charge

Related Questions

Q122: The following table gives the cost and

Q123: Cost and revenue functions are graphed in

Q124: Estimate <img src="https://d2lvgg3v3hfg70.cloudfront.net/TB8190/.jpg" alt="Estimate when

Q125: An amount of $500 was invested in

Q126: Given the following data about the function

Q127: The graph below is the graph of

Q129: Consider the following graph. In region III,

Q130: The noise level, N, in decibels, of

Q131: Let <img src="https://d2lvgg3v3hfg70.cloudfront.net/TB8190/.jpg" alt="Let represent

Q132: Using a calculator, estimate the derivative of

Examlex

ExamLex

About UsContact UsPerks CenterHomeschoolingTest Prep

Work With Us

Campus RepresentativeInfluencers

Links

FaqPricingChrome Extension

Download The App

Get App StoreGet Google Play

Policies

Privacy PolicyTerms of ServiceHonor CodeCommunity Guidelines

Scan To Download

qr-code

Copyright © (2025) ExamLex LLC.

Privacy PolicyTerms Of ServiceHonor CodeCommunity Guidelines