Multiple Choice
The following table gives the number of passenger cars, in millions, in the United States, C, as a function of years, t. We have  . Estimate
  . Use the nearest right-hand value to make your estimate.
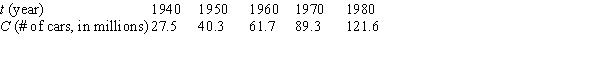
A) 2.14 million cars/year
B) 40.3 million cars/year
C) 44.6 million cars/year
D) 3.71 million cars/year
Correct Answer:

Verified
Correct Answer:
Verified
Q97: At a production level of 2000 for
Q98: Using the graph of <img src="https://d2lvgg3v3hfg70.cloudfront.net/TB8190/.jpg" alt="Using
Q99: Let <img src="https://d2lvgg3v3hfg70.cloudfront.net/TB8190/.jpg" alt="Let be
Q100: Let <img src="https://d2lvgg3v3hfg70.cloudfront.net/TB8190/.jpg" alt="Let be
Q101: The following table gives the wind chill
Q103: Let <img src="https://d2lvgg3v3hfg70.cloudfront.net/TB8190/.jpg" alt="Let be
Q104: Let <img src="https://d2lvgg3v3hfg70.cloudfront.net/TB8190/.jpg" alt="Let .
Q105: The graph of a cost function is
Q106: Using the graph of <img src="https://d2lvgg3v3hfg70.cloudfront.net/TB8190/.jpg" alt="Using
Q107: Suppose the graph of f is in