Multiple Choice
The graph of a cost function is given in the following figure. Which item costs the most to produce? 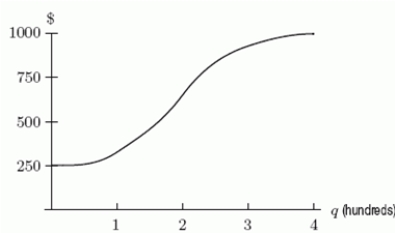
A) The 300th item
B) The 100th item
C) The 200th item
Correct Answer:

Verified
Correct Answer:
Verified
Q100: Let <img src="https://d2lvgg3v3hfg70.cloudfront.net/TB8190/.jpg" alt="Let be
Q101: The following table gives the wind chill
Q102: The following table gives the number of
Q103: Let <img src="https://d2lvgg3v3hfg70.cloudfront.net/TB8190/.jpg" alt="Let be
Q104: Let <img src="https://d2lvgg3v3hfg70.cloudfront.net/TB8190/.jpg" alt="Let .
Q106: Using the graph of <img src="https://d2lvgg3v3hfg70.cloudfront.net/TB8190/.jpg" alt="Using
Q107: Suppose the graph of f is in
Q108: Consider the function f sketched in the
Q109: The function <img src="https://d2lvgg3v3hfg70.cloudfront.net/TB8190/.jpg" alt="The function
Q110: A company graphs <img src="https://d2lvgg3v3hfg70.cloudfront.net/TB8190/.jpg" alt="A company