Short Answer
Suppose the graph of f is in the figure below. Is  positive, negative, or zero?
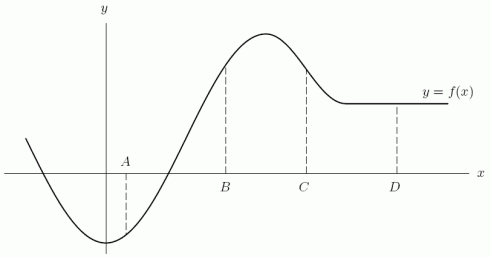
Correct Answer:

Verified
Correct Answer:
Verified
Q102: The following table gives the number of
Q103: Let <img src="https://d2lvgg3v3hfg70.cloudfront.net/TB8190/.jpg" alt="Let be
Q104: Let <img src="https://d2lvgg3v3hfg70.cloudfront.net/TB8190/.jpg" alt="Let .
Q105: The graph of a cost function is
Q106: Using the graph of <img src="https://d2lvgg3v3hfg70.cloudfront.net/TB8190/.jpg" alt="Using
Q108: Consider the function f sketched in the
Q109: The function <img src="https://d2lvgg3v3hfg70.cloudfront.net/TB8190/.jpg" alt="The function
Q110: A company graphs <img src="https://d2lvgg3v3hfg70.cloudfront.net/TB8190/.jpg" alt="A company
Q111: The graph of <img src="https://d2lvgg3v3hfg70.cloudfront.net/TB8190/.jpg" alt="The graph
Q112: From the following graph, estimate <img src="https://d2lvgg3v3hfg70.cloudfront.net/TB8190/.jpg"