Short Answer
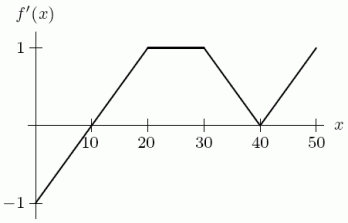
The graph of  is shown in the following figure. Given that
  , find
  .
. 
Correct Answer:

Verified
Correct Answer:
Verified
Related Questions
Q28: Below is a graph of the rate
Q29: Find <img src="https://d2lvgg3v3hfg70.cloudfront.net/TB8190/.jpg" alt="Find for
Q30: Use the following figure to estimate <img
Q31: The Ethnic food line at the Cougar
Q32: In the following graph, does <img src="https://d2lvgg3v3hfg70.cloudfront.net/TB8190/.jpg"
Q34: A. Find a 4-term left Riemann sum
Q35: Two cars start at the same time
Q36: At time t, in seconds, the velocity
Q37: Data for a function G is given
Q38: Your rich eccentric friend has hired you