Multiple Choice
Below is a graph of the rate r in arrivals per minute at which students line up for breakfast. The first people arrive at 6:50 am and the line opens at 7:00 am. The line serves students at a constant rate of 20 students per minute. Estimate the length of the line at 7:10. 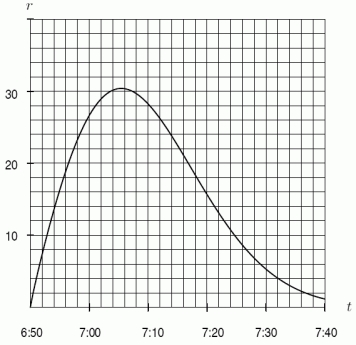
A) 240
B) 340
C) 440
D) 540
Correct Answer:

Verified
Correct Answer:
Verified
Q23: Data for a function G is given
Q24: If a function is concave up, then
Q25: A reagent is cooling in a laboratory
Q26: Use the following graph to estimate <img
Q27: Estimate the area above the curve <img
Q29: Find <img src="https://d2lvgg3v3hfg70.cloudfront.net/TB8190/.jpg" alt="Find for
Q30: Use the following figure to estimate <img
Q31: The Ethnic food line at the Cougar
Q32: In the following graph, does <img src="https://d2lvgg3v3hfg70.cloudfront.net/TB8190/.jpg"
Q33: The graph of <img src="https://d2lvgg3v3hfg70.cloudfront.net/TB8190/.jpg" alt="The graph