Short Answer
Use the following figure to estimate  (average left- and right-hand sums).
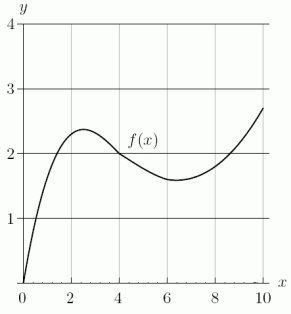
Correct Answer:

Verified
Correct Answer:
Verified
Related Questions
Q25: A reagent is cooling in a laboratory
Q26: Use the following graph to estimate <img
Q27: Estimate the area above the curve <img
Q28: Below is a graph of the rate
Q29: Find <img src="https://d2lvgg3v3hfg70.cloudfront.net/TB8190/.jpg" alt="Find for
Q31: The Ethnic food line at the Cougar
Q32: In the following graph, does <img src="https://d2lvgg3v3hfg70.cloudfront.net/TB8190/.jpg"
Q33: The graph of <img src="https://d2lvgg3v3hfg70.cloudfront.net/TB8190/.jpg" alt="The graph
Q34: A. Find a 4-term left Riemann sum
Q35: Two cars start at the same time