menu-iconExamlexExamLexServices

Discover

Ask a Question
  1. All Topics
  2. Topic
    Mathematics
  3. Study Set
    Applied Calculus
  4. Exam
    Exam 5: Accumulated Change: the Definite Integral
  5. Question
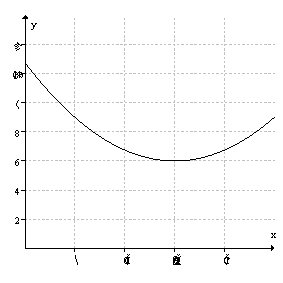
    The Graph Below Shows a Marginal Cost Function
Solved

The Graph Below Shows a Marginal Cost Function

Question 7

Question 7

Multiple Choice

The graph below shows a marginal cost function, The graph below shows a marginal cost function,   $ per item. If the fixed cost is $900, estimate the total cost of producing 250 items.   A) $ 2850 B) $ 1950 C) $1530 D) $2950 $ per item. If the fixed cost is $900, estimate the total cost of producing 250 items. The graph below shows a marginal cost function,   $ per item. If the fixed cost is $900, estimate the total cost of producing 250 items.   A) $ 2850 B) $ 1950 C) $1530 D) $2950

A) $ 2850
B) $ 1950
C) $1530
D) $2950

Correct Answer:

verifed

Verified

Unlock this answer now
Get Access to more Verified Answers free of charge

Related Questions

Q2: After a foreign substance is introduced into

Q3: The flow rate of water in a

Q4: The following table gives the rate <img

Q5: At time t, in seconds, your velocity,

Q6: The rate of growth of the net

Q8: The following figure shows the rate of

Q9: The rate of pollution pouring into a

Q10: Suppose <img src="https://d2lvgg3v3hfg70.cloudfront.net/TB8190/.jpg" alt="Suppose is

Q11: Using the following figure, calculate the value

Q12: Use a calculator to evaluate <img src="https://d2lvgg3v3hfg70.cloudfront.net/TB8190/.jpg"

Examlex

ExamLex

About UsContact UsPerks CenterHomeschoolingTest Prep

Work With Us

Campus RepresentativeInfluencers

Links

FaqPricingChrome Extension

Download The App

Get App StoreGet Google Play

Policies

Privacy PolicyTerms of ServiceHonor CodeCommunity Guidelines

Scan To Download

qr-code

Copyright © (2025) ExamLex LLC.

Privacy PolicyTerms Of ServiceHonor CodeCommunity Guidelines