Short Answer
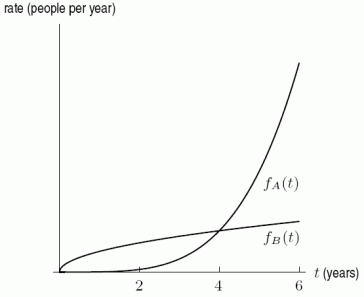
The following figure shows the rate of growth of two cities, with  being the growth of City A after t years and
  being the growth of City B after t years. If the two cities have the same population at t = 0, arrange the following values in order from smallest to largest by placing a "1" by the smallest, a "2" by the next smallest, and so forth.
A.  B.
B.  C.
C.  D.
D. 
Correct Answer:

Verified
Part A: 1
...View Answer
Unlock this answer now
Get Access to more Verified Answers free of charge
Correct Answer:
Verified
...
View Answer
Unlock this answer now
Get Access to more Verified Answers free of charge
Q3: The flow rate of water in a
Q4: The following table gives the rate <img
Q5: At time t, in seconds, your velocity,
Q6: The rate of growth of the net
Q7: The graph below shows a marginal cost
Q9: The rate of pollution pouring into a
Q10: Suppose <img src="https://d2lvgg3v3hfg70.cloudfront.net/TB8190/.jpg" alt="Suppose is
Q11: Using the following figure, calculate the value
Q12: Use a calculator to evaluate <img src="https://d2lvgg3v3hfg70.cloudfront.net/TB8190/.jpg"
Q13: The following figure shows the graph of