Short Answer
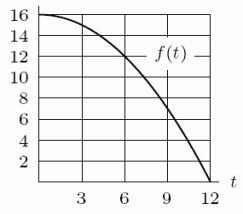
Using the following figure, calculate the value of the right-hand Riemann sum for the function f on the interval  using
using  .
. 
Correct Answer:

Verified
Correct Answer:
Verified
Related Questions
Q6: The rate of growth of the net
Q7: The graph below shows a marginal cost
Q8: The following figure shows the rate of
Q9: The rate of pollution pouring into a
Q10: Suppose <img src="https://d2lvgg3v3hfg70.cloudfront.net/TB8190/.jpg" alt="Suppose is
Q12: Use a calculator to evaluate <img src="https://d2lvgg3v3hfg70.cloudfront.net/TB8190/.jpg"
Q13: The following figure shows the graph of
Q14: Use the following figure to find the
Q15: If <img src="https://d2lvgg3v3hfg70.cloudfront.net/TB8190/.jpg" alt="If and
Q16: Consider a sports car which accelerates from