menu-iconExamlexExamLexServices

Discover

Ask a Question
  1. All Topics
  2. Topic
    Statistics
  3. Study Set
    Basic Business Statistics
  4. Exam
    Exam 2: Organizing and Visualizing Data
  5. Question
    Given Below Is the Scatter Plot of the Price/earnings Ratio
Solved

Given Below Is the Scatter Plot of the Price/earnings Ratio

Question 70

Question 70

True/False

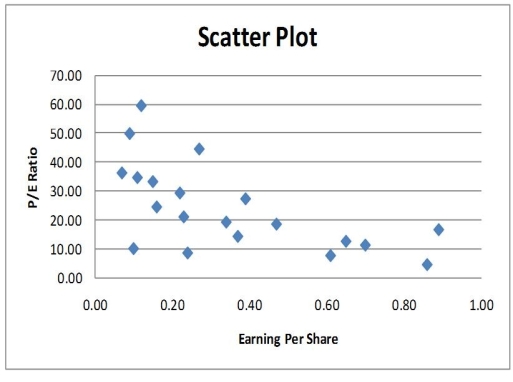
Given below is the scatter plot of the price/earnings ratio versus earnings per share of 20 U.S.companies.There appears to be a negative relationship between price/earnings ratio and earnings per share.

Correct Answer:

verifed

Verified

Unlock this answer now
Get Access to more Verified Answers free of charge

Related Questions

Q2: To determine the width of class interval,

Q7: TABLE 2-14<br>The table below contains the number

Q14: TABLE 2-9<br>The frequency distribution below represents the

Q16: If the values of the seventh and

Q44: TABLE 2-8<br>The Stem-and-Leaf display represents the number

Q58: The main principle behind the Pareto chart

Q125: TABLE 2-12<br>The table below contains the opinions

Q147: TABLE 2-5<br>The following are the duration in

Q175: TABLE 2-8<br>The Stem-and-Leaf display represents the number

Q190: TABLE 2-12<br>The table below contains the opinions

Examlex

ExamLex

About UsContact UsPerks CenterHomeschoolingTest Prep

Work With Us

Campus RepresentativeInfluencers

Links

FaqPricingChrome Extension

Download The App

Get App StoreGet Google Play

Policies

Privacy PolicyTerms of ServiceHonor CodeCommunity Guidelines

Scan To Download

qr-code

Copyright © (2025) ExamLex LLC.

Privacy PolicyTerms Of ServiceHonor CodeCommunity Guidelines