Multiple Choice
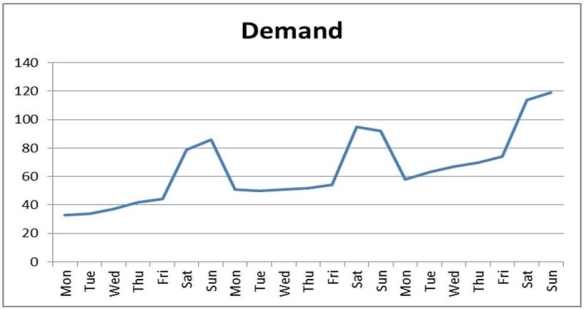
Graph 8.1
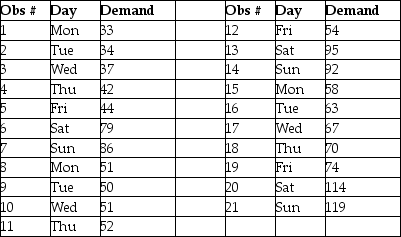
Data plotted in the graph appear in the table below.


-Refer to Graph 8.1. What is the seasonal index for the first Saturday in the data set?
A) 1.69
B) 1.56
C) 0.64
D) 0.58
Correct Answer:

Verified
Correct Answer:
Verified
Related Questions
Q1: Graph 8.1<br>Data plotted in the graph appear
Q2: A bias error results from unpredictable factors
Q3: The _ variable is the variable that
Q4: Focus forecasting selects the best forecast from
Q5: Table 8.4<br>The Furniture Super Mart is a
Q7: A tracking signal greater than zero and
Q8: The judgment methods of forecasting are to
Q9: When the underlying mean of a time
Q10: A(n) _ forecast is a time-series method
Q11: Graph 8.1<br>Data plotted in the graph appear