Multiple Choice
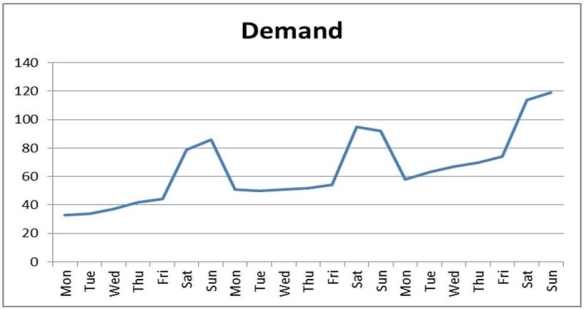
Graph 8.1
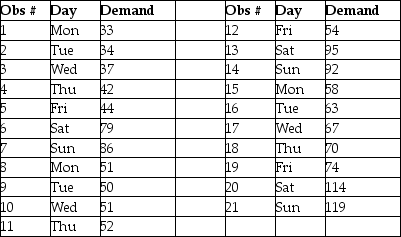
Data plotted in the graph appear in the table below.


-Refer to Graph 8.1. Use a trend projection to forecast the next week's demand. Then apply seasonal indices to determine the demand on Saturday of the fourth week. What is the demand projected to be?
A) 141.4
B) 146.2
C) 151.3
D) 158.9
Correct Answer:

Verified
Correct Answer:
Verified
Q2: A bias error results from unpredictable factors
Q3: The _ variable is the variable that
Q4: Focus forecasting selects the best forecast from
Q5: Table 8.4<br>The Furniture Super Mart is a
Q6: Graph 8.1<br>Data plotted in the graph appear
Q7: A tracking signal greater than zero and
Q8: The judgment methods of forecasting are to
Q9: When the underlying mean of a time
Q10: A(n) _ forecast is a time-series method
Q11: Graph 8.1<br>Data plotted in the graph appear