Multiple Choice
This figure is an example of a: 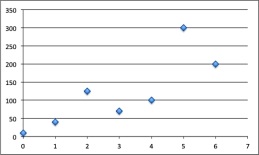
A) line graph.
B) scatterplot.
C) smoothed line graph.
D) bar graph.
Correct Answer:

Verified
Correct Answer:
Verified
Related Questions
Q40: The average growth rate of a function
Q41: If inflation from year 1 to year
Q42: This figure is an example of a:
Q43: When one quantity, or variable, depends on
Q44: The following table shows the world population
Q46: The following table shows the world population
Q47: Once you purchase a new computer, its
Q48: The following table shows the percentage of
Q49: The following bar graph shows the annual
Q50: The following table from the World Health