Multiple Choice
The following bar graph shows the annual attendance at a state fair: 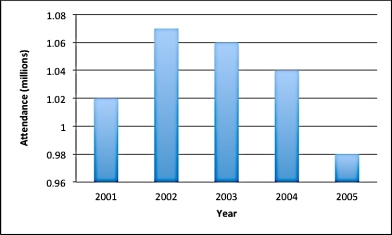 You are asked to redesign the bar chart to DE-EMPHASIZE the change in attendance. You would use a _____ range on the _____ axis.
A) narrower; vertical
B) wider; vertical
C) narrower; horizontal
D) wider; horizontal
Correct Answer:

Verified
Correct Answer:
Verified
Q44: The following table shows the world population
Q45: This figure is an example of a:
Q46: The following table shows the world population
Q47: Once you purchase a new computer, its
Q48: The following table shows the percentage of
Q50: The following table from the World Health
Q51: As an automobile ages, gas mileage typically
Q52: The following table shows the average price
Q53: Suppose the inflation rate of a country
Q54: The following table shows the average price