Multiple Choice
Once you purchase a new computer, its value decreases at a decreasing rate. Which graph best represents this?
A) 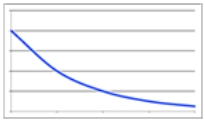
B) 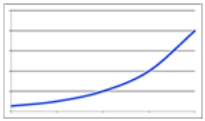
C) 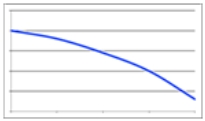
D) 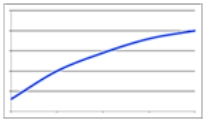
Correct Answer:

Verified
Correct Answer:
Verified
Related Questions
Q42: This figure is an example of a:
Q43: When one quantity, or variable, depends on
Q44: The following table shows the world population
Q45: This figure is an example of a:
Q46: The following table shows the world population
Q48: The following table shows the percentage of
Q49: The following bar graph shows the annual
Q50: The following table from the World Health
Q51: As an automobile ages, gas mileage typically
Q52: The following table shows the average price