Multiple Choice
As an automobile ages, gas mileage typically decreases, and it decreases at an increasing rate. Which graph best represents this?
A) 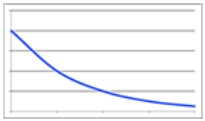
B) 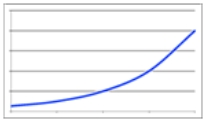
C) 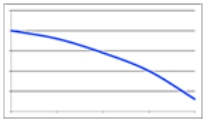
D) 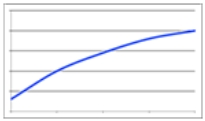
Correct Answer:

Verified
Correct Answer:
Verified
Related Questions
Q46: The following table shows the world population
Q47: Once you purchase a new computer, its
Q48: The following table shows the percentage of
Q49: The following bar graph shows the annual
Q50: The following table from the World Health
Q52: The following table shows the average price
Q53: Suppose the inflation rate of a country
Q54: The following table shows the average price
Q55: The following table shows the percentage of
Q56: An epidemic is spreading by an average