menu-iconExamlexExamLexServices

Discover

Ask a Question
  1. All Topics
  2. Topic
    Statistics
  3. Study Set
    Basic Business Statistics
  4. Exam
    Exam 2: Organizing and Visualizing Data
  5. Question
    Given Below Is the Scatter Plot of the Number of Employees
Solved

Given Below Is the Scatter Plot of the Number of Employees

Question 67

Question 67

True/False

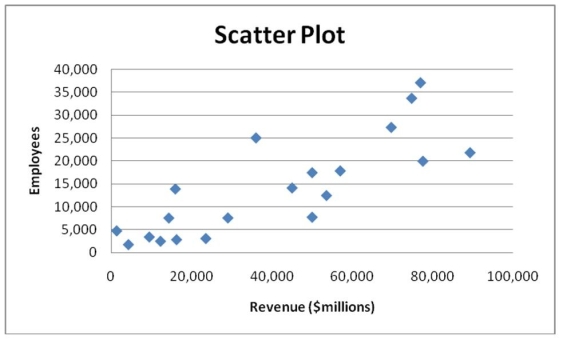
Given below is the scatter plot of the number of employees and the total revenue ($millions)of 20 U.S. companies. There appears to be a positive relationship between total revenue and the number of employees.

Correct Answer:

verifed

Verified

Unlock this answer now
Get Access to more Verified Answers free of charge

Related Questions

Q20: You have collected data on the approximate

Q60: TABLE 2-10<br>The histogram below represents scores achieved

Q94: TABLE 2-15<br>The figure below is the ogive

Q111: SCENARIO 2-2<br>2-2 Organizing and Visualizing Variables<br>At a

Q122: TABLE 2-12<br>The table below contains the opinions

Q149: TABLE 2-8<br>The Stem-and-Leaf display represents the number

Q151: TABLE 2-4<br>A survey was conducted to determine

Q152: TABLE 2-10<br>The histogram below represents scores achieved

Q168: TABLE 2-11<br>The ordered array below resulted from

Q204: TABLE 2-8<br>The Stem-and-Leaf display represents the number

Examlex

ExamLex

About UsContact UsPerks CenterHomeschoolingTest Prep

Work With Us

Campus RepresentativeInfluencers

Links

FaqPricingChrome Extension

Download The App

Get App StoreGet Google Play

Policies

Privacy PolicyTerms of ServiceHonor CodeCommunity Guidelines

Scan To Download

qr-code

Copyright © (2025) ExamLex LLC.

Privacy PolicyTerms Of ServiceHonor CodeCommunity Guidelines