Short Answer
TABLE 13-13
In this era of tough economic conditions, voters increasingly ask the question: "Is the educational achievement level of students dependent on the amount of money the state in which they reside spends on education?" The partial computer output below is the result of using spending per student ($) as the independent variable and composite score which is the sum of the math, science and reading scores as the dependent variable on 35 states that participated in a study. The table includes only partial results.
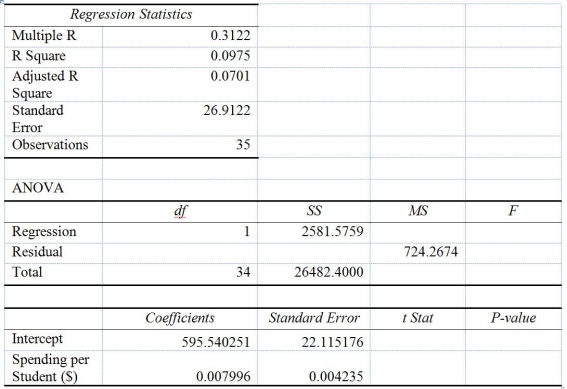
-Referring to Table 13-13, what percentage of the variation in composite score can be explained by the variation in spending per student?
Correct Answer:

Verified
Correct Answer:
Verified
Q2: TABLE 13-4<br>The managers of a brokerage firm
Q3: TABLE 13-4<br>The managers of a brokerage firm
Q5: TABLE 13-7<br>An investment specialist claims that if
Q6: TABLE 13-8<br>It is believed that GPA (grade
Q8: TABLE 13-2<br>A candy bar manufacturer is interested
Q9: Referring to Table 13-2, what is <img
Q10: TABLE 13-13<br>In this era of tough economic
Q11: TABLE 13-4<br>The managers of a brokerage firm
Q101: The Regression Sum of Squares (SSR)can never
Q198: The width of the prediction interval for