Multiple Choice
Below is a frequency table showing the number of new restaurants opened in the city over the past 24 months.Compute the mean number of openings per month over this 24-month period. 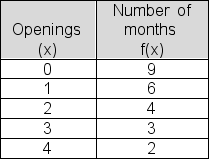
A) .97
B) 1.29
C) 1.06
D) 1.61
E) 1.74
Correct Answer:

Verified
Correct Answer:
Verified
Related Questions
Q20: Below is a frequency table showing the
Q21: Below is a list of shipping costs
Q22: For a sample of 10 days, Harkin
Q23: When looking at the shape of a
Q24: The following chart gives the number of
Q26: The relative frequency table below shows the
Q27: A data set consists of 10 values:
Q28: In a recent survey, 75 college students
Q29: Over the past 30 days, Kim recorded
Q30: The number of US solar energy companies