Multiple Choice
Below is a frequency table showing the number of new restaurants opened in the city over the past 24 months.Compute the standard deviation of the number of openings data.Treat the data as a population. 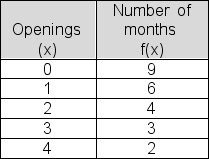
A) .54
B) 1.31
C) 2.47
D) 2.13
E) 1.72
Correct Answer:

Verified
Correct Answer:
Verified
Related Questions
Q15: The main difference between a bar chart
Q16: The number of US solar energy companies
Q17: In a recent survey, 75 college students
Q18: Turcott Roof and Deck has 130 jobs
Q19: The degree to which a data distribution
Q21: Below is a list of shipping costs
Q22: For a sample of 10 days, Harkin
Q23: When looking at the shape of a
Q24: The following chart gives the number of
Q25: Below is a frequency table showing the