Multiple Choice
The following chart gives the number of full years served by the first 42 presidents of the United States (up to and including George W.Bush) .What is the standard deviation of full years served by the first 42 presidents of the United States? Remember that this includes all of the presidents. 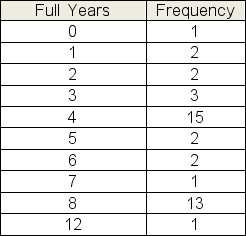
A) 2.0 years
B) 4.0 years
C) 5.2 years
D) 6.5 years
E) 8.3 years
Correct Answer:

Verified
Correct Answer:
Verified
Q19: The degree to which a data distribution
Q20: Below is a frequency table showing the
Q21: Below is a list of shipping costs
Q22: For a sample of 10 days, Harkin
Q23: When looking at the shape of a
Q25: Below is a frequency table showing the
Q26: The relative frequency table below shows the
Q27: A data set consists of 10 values:
Q28: In a recent survey, 75 college students
Q29: Over the past 30 days, Kim recorded