Multiple Choice
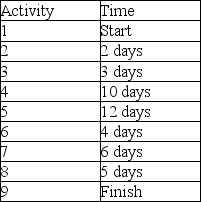
The AON diagram shown represents a project. If the estimated times for each activity are as shown in the accompanying table, what is the estimated completion time for the project? 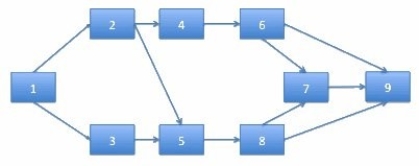
A) 16 days
B) 20 days
C) 26 days
D) 30 days
E) 32 days
Correct Answer:

Verified
Correct Answer:
Verified
Q40: Identify some similarities and differences between the
Q41: Which of the following project management tools
Q42: At what stage of a project's lifecycle
Q43: The AON diagram shown represents a project.
Q44: As a rule, each project includes a
Q46: A construction company has just started building
Q47: Developing a new electronics product involves two
Q48: What is "crashing"?<br>A)time until a capital asset
Q49: Who is responsible for the detailed project
Q50: A 5-year project requires $10 million in