Multiple Choice
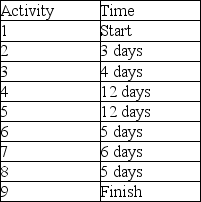
The AON diagram shown represents a project. If the estimated times for each activity are as shown in the accompanying table, how much slack is there in the completion of Activity 5? 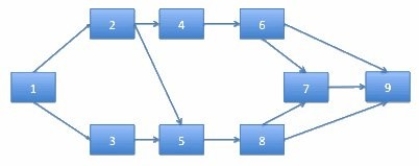
A) There is no slack, because Activity 5 is on the critical path.
B) 1 day
C) 2 days
D) 3 days
E) 4 days
Correct Answer:

Verified
Correct Answer:
Verified
Q19: A Gantt Chart is<br>A)a chart that depicts
Q20: When resources such as overtime, extra equipment,
Q21: Define the process of project management.
Q22: The required resources for an engineering project
Q23: What does `PERT' stand for?<br>A)Probable Engineering Return
Q25: In order to calculate the crash cost
Q26: What is the difference between a diagram
Q27: Finding ES, EF, LS, and LF requires<br>A)one
Q28: What is the Work Breakdown Structure (WBS)?
Q29: The lifecycle of a project is given