Multiple Choice
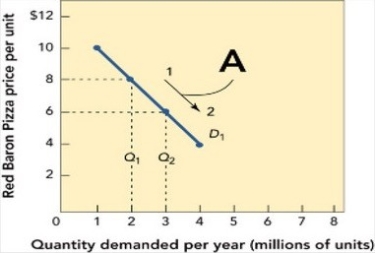 Figure 11-3a
-Figure 11-3a above shows that when the price for Red Baron frozen cheese pizzas moves from $8 to $6 per unit along the demand curve D1, the quantity demanded
A) increases from 2 to 3 million units per year.
B) decreases from 3 to 2 million units per year.
C) stays the same.
D) increases from 6 to 8 million units per year.
E) decreases from 8 to 6 million units per year.
Correct Answer:

Verified
Correct Answer:
Verified
Q19: Predatory pricing is<br>A) an arrangement a manufacturer
Q52: The break-even point (BEP) = [Fixed cost
Q90: There are several factors that predict when
Q94: When is skimming pricing an effective strategy?
Q96: <img src="https://d2lvgg3v3hfg70.cloudfront.net/TB8552/.jpg" alt=" Figure 11-6a -Suppose
Q98: All of the following are demand factors
Q119: The formula Total revenue − Total cost
Q175: The unit variable cost (UVC) equals variable
Q175: Target return-on-investment pricing refers to<br>A) setting a
Q281: The owner of a store that sells