Multiple Choice
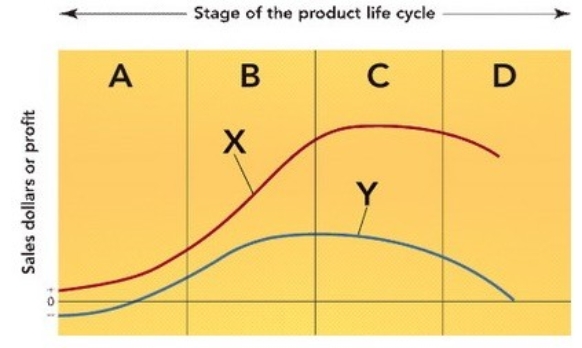 Figure 10-1
-Figure 10-1 above represents the stages of the product life cycle. What does the section of the graph labeled D represent?
A) retrenching
B) maturity
C) growth
D) failure
E) decline
Correct Answer:

Verified
Correct Answer:
Verified
Q102: Georgia-Pacific reduced the content of its Brawny
Q130: Reducing the package content without changing package
Q131: Advertising and promotion costs tend to be
Q175: <img src="https://d2lvgg3v3hfg70.cloudfront.net/TB8552/.jpg" alt=" Figure 10-7 -Companies
Q177: Hot-Can Café Latte comes in single-serving, self-heating
Q179: In terms of its effect on faxing,
Q180: Brand equity is<br>A) the resources invested to
Q185: When a product reaches the decline stage
Q198: When General Mills teams up with Hershey
Q254: Brand equity provides a financial advantage for