Multiple Choice
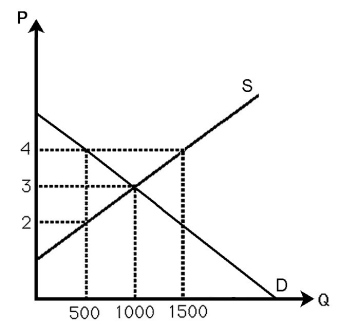
-The above figure shows the demand and supply curves in the market for milk.If the government imposes a quota at 500 gallons,calculate the change in the consumer surplus.
A) △CS = -250
B) △CS = -150
C) △CS = -500
D) △CS = 200
Correct Answer:

Verified
Correct Answer:
Verified
Q110: <img src="https://d2lvgg3v3hfg70.cloudfront.net/TB6808/.jpg" alt=" -The above figure
Q111: If a market produces a level of
Q112: If a city decides to lift restrictions
Q113: What is one reason activists might lobby
Q114: Long-run economic profit does not exist for
Q116: <img src="https://d2lvgg3v3hfg70.cloudfront.net/TB6808/.jpg" alt=" -The above figure
Q117: <img src="https://d2lvgg3v3hfg70.cloudfront.net/TB6808/.jpg" alt=" -The above figure
Q118: <img src="https://d2lvgg3v3hfg70.cloudfront.net/TB6808/.jpg" alt=" -The above figure
Q119: The services of real estate brokers are
Q120: An increase in the deadweight loss (DWL)means<br>A)