Multiple Choice
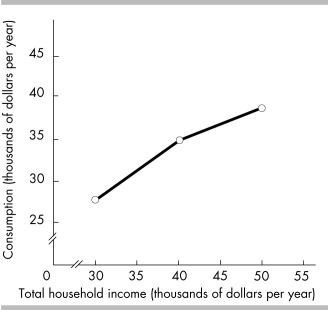
-The above figure shows the relationship between the Joneses' total consumption and total household income. The figure illustrates that the Joneses' total consumption varies
A) directly with their total household income.
B) independently of their total household income.
C) inversely with their total household income.
D) negatively with their income.
Correct Answer:

Verified
Correct Answer:
Verified
Q69: When the government chooses to spend the
Q70: Consider a diagram in which the variable
Q71: Ceteris paribus when graphing a relationship refers
Q72: <img src="https://d2lvgg3v3hfg70.cloudfront.net/TB8586/.jpg" alt=" -The slope of
Q73: The statement "Unemployment should be below 6
Q75: <img src="https://d2lvgg3v3hfg70.cloudfront.net/TB8586/.jpg" alt=" -The slope of
Q76: <img src="https://d2lvgg3v3hfg70.cloudfront.net/TB8586/.jpg" alt=" -In the above
Q77: <img src="https://d2lvgg3v3hfg70.cloudfront.net/TB8586/.jpg" alt=" -In the above
Q78: Dell Computers decides to produce PCs and
Q79: Jill, an economics student, has already spent