Multiple Choice
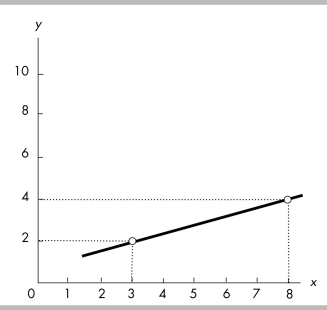
-The slope of the line shown in the above figure is
A) 5.
B) 2/5.
C) 2/3.
D) 5/2.
Correct Answer:

Verified
Correct Answer:
Verified
Q67: <img src="https://d2lvgg3v3hfg70.cloudfront.net/TB8586/.jpg" alt=" -In the figure
Q68: If a curve falls and then rises,
Q69: When the government chooses to spend the
Q70: Consider a diagram in which the variable
Q71: Ceteris paribus when graphing a relationship refers
Q73: The statement "Unemployment should be below 6
Q74: <img src="https://d2lvgg3v3hfg70.cloudfront.net/TB8586/.jpg" alt=" -The above figure
Q75: <img src="https://d2lvgg3v3hfg70.cloudfront.net/TB8586/.jpg" alt=" -The slope of
Q76: <img src="https://d2lvgg3v3hfg70.cloudfront.net/TB8586/.jpg" alt=" -In the above
Q77: <img src="https://d2lvgg3v3hfg70.cloudfront.net/TB8586/.jpg" alt=" -In the above