Multiple Choice
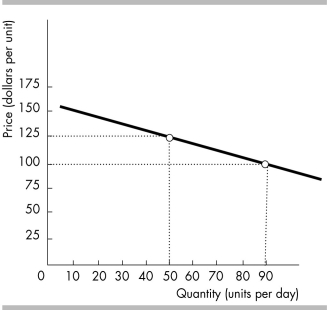
-The slope of the line shown in the above figure is
A) -1 3/8.
B) -1 2/3.
C) 5/8.
D) -0.625.
Correct Answer:

Verified
Correct Answer:
Verified
Q70: Consider a diagram in which the variable
Q71: Ceteris paribus when graphing a relationship refers
Q72: <img src="https://d2lvgg3v3hfg70.cloudfront.net/TB8586/.jpg" alt=" -The slope of
Q73: The statement "Unemployment should be below 6
Q74: <img src="https://d2lvgg3v3hfg70.cloudfront.net/TB8586/.jpg" alt=" -The above figure
Q76: <img src="https://d2lvgg3v3hfg70.cloudfront.net/TB8586/.jpg" alt=" -In the above
Q77: <img src="https://d2lvgg3v3hfg70.cloudfront.net/TB8586/.jpg" alt=" -In the above
Q78: Dell Computers decides to produce PCs and
Q79: Jill, an economics student, has already spent
Q80: <img src="https://d2lvgg3v3hfg70.cloudfront.net/TB8586/.jpg" alt=" -The figure above