Multiple Choice
Use the graph to answer the following question. 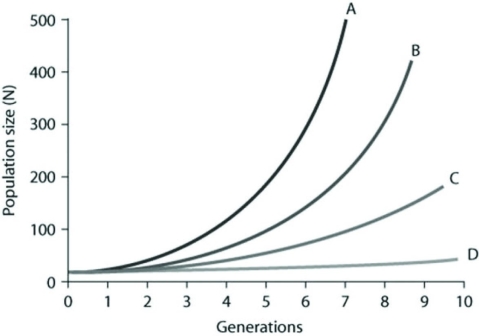 In the figure, curves A-D depict per capita rate increases (r) . Which of the following best explains the difference between the shapes of these curves?
A) The population growth is logistic as generations continue to form.
B) The growth is exponential for curves A and B, but because population growth for C and D is slower, it is considered logistic.
C) Population growth within each curve gets steeper as time passes because growth depends on both per capita rates of increase and current population size.
D) Curve A has the fastest rate of logistic growth.
Correct Answer:

Verified
Correct Answer:
Verified
Q1: Use the hypothetical or idealized survivorship curves
Q2: In a field of corn or lettuce
Q3: Which of the following statements regarding the
Q5: Use the graph to answer the following
Q6: Which of the following is most consistent
Q7: In April 2019, the population in the
Q8: Which of the following is consistent with
Q9: In 2019, the United States Census Bureau
Q10: Use the graphs to answer the following
Q11: Which of the following statements about human