Multiple Choice
Use the hypothetical or idealized survivorship curves in the figure to answer the following question. 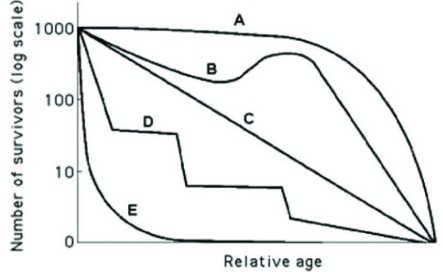 Which of the following curves describes survivorship that is most typical in marine fish or mollusks?
A) A
B) B
C) C
D) E
Correct Answer:

Verified
Correct Answer:
Verified
Related Questions
Q2: In a field of corn or lettuce
Q3: Which of the following statements regarding the
Q4: Use the graph to answer the following
Q5: Use the graph to answer the following
Q6: Which of the following is most consistent
Q7: In April 2019, the population in the
Q8: Which of the following is consistent with
Q9: In 2019, the United States Census Bureau
Q10: Use the graphs to answer the following
Q11: Which of the following statements about human