Multiple Choice
Figure 53-1
Use the figure to answer the corresponding question(s) . 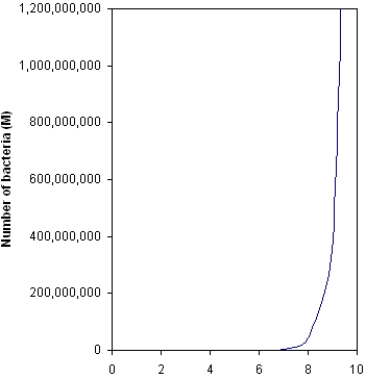
-The graph in Figure 53-1 would best be described as:
A) being characteristic of exponential growth.
B) being characteristic of arithmetic growth.
C) an S-shaped curve.
D) a J-shaped curve.
E) being a J-shaped curve characteristic of exponential growth.
Correct Answer:

Verified
Correct Answer:
Verified
Q2: Members of an r-selected species typically have
Q14: Scramble competition results when all individuals in
Q20: The potential capacity to produce offspring is
Q71: Figure 53-6<br>Use the figure to answer the
Q72: MATCHING<br>Match the term in a growth rate
Q74: Figure 53-2<br>Use the figure to answer the
Q75: When r = -0.00057, the population size:<br>A)
Q78: The term referring to the rate at
Q80: Features that are typical of K-selected organisms
Q95: Most insects and invertebrates are said to