Multiple Choice
Figure 53-6
Use the figure to answer the corresponding question(s) . 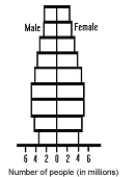
-Figure 53-6 represents the age structure diagram of:
A) the transition stage.
B) the preindustrial state.
C) a moderately developed country.
D) a developing country.
E) a highly developed country.
Correct Answer:

Verified
Correct Answer:
Verified
Q2: Members of an r-selected species typically have
Q50: The percentages of a population at different
Q66: Which of the following pairs is incorrect?<br>A)
Q67: MATCHING<br>Match the term in a growth rate
Q69: Which of the following sets of values
Q70: MATCHING<br>Match the term in a growth rate
Q72: MATCHING<br>Match the term in a growth rate
Q74: Figure 53-2<br>Use the figure to answer the
Q75: When r = -0.00057, the population size:<br>A)
Q76: Figure 53-1<br>Use the figure to answer the