Multiple Choice
Figure 53-2
Use the figure to answer the corresponding question(s) . 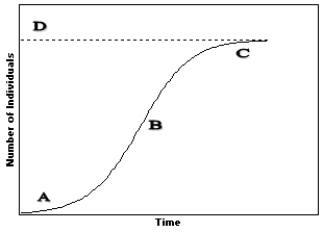
-Refer to Figure 53-2.At which point on the graph is the population increasing exponentially?
A) A
B) B
C) C
D) D
E) There is no exponential increase on this graph.
Correct Answer:

Verified
Correct Answer:
Verified
Related Questions
Q2: Members of an r-selected species typically have
Q20: The potential capacity to produce offspring is
Q69: Which of the following sets of values
Q70: MATCHING<br>Match the term in a growth rate
Q71: Figure 53-6<br>Use the figure to answer the
Q72: MATCHING<br>Match the term in a growth rate
Q75: When r = -0.00057, the population size:<br>A)
Q76: Figure 53-1<br>Use the figure to answer the
Q78: The term referring to the rate at
Q95: Most insects and invertebrates are said to