Multiple Choice
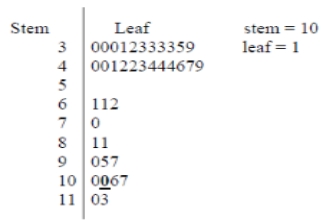 What is the value of the data point represented by the bold and underlined "0" in the stem-and-leaf diagram? (Note: It is bold and underlined for emphasis only.)
A) 1
B) 10
C) 100
D) 1000
Correct Answer:

Verified
Correct Answer:
Verified
Q2: <img src="https://d2lvgg3v3hfg70.cloudfront.net/TB8195/.jpg" alt=" This stem-and-leaf plot
Q3: A particular advantage of a stem-and-leaf plot
Q4: Two statistics students are arguing over which
Q5: <img src="https://d2lvgg3v3hfg70.cloudfront.net/TB8195/.jpg" alt=" What data value
Q6: <img src="https://d2lvgg3v3hfg70.cloudfront.net/TB8195/.jpg" alt=" Judging from this
Q8: <img src="https://d2lvgg3v3hfg70.cloudfront.net/TB8195/.jpg" alt=" This stem-and-leaf plot
Q9: Relative frequency is best suited to describing
Q10: <img src="https://d2lvgg3v3hfg70.cloudfront.net/TB8195/.jpg" alt=" This stem-and-leaf plot
Q11: A student counted the number of candies
Q12: <img src="https://d2lvgg3v3hfg70.cloudfront.net/TB8195/.jpg" alt=" The shape of