Multiple Choice
 Judging from this stem-and-leaf display, the data set appears to be:
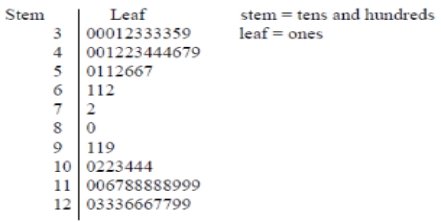
A) skewed.
B) uniform.
C) symmetric.
D) centered at 100.
Correct Answer:

Verified
Correct Answer:
Verified
Q1: This table summarizes the responses to a
Q2: <img src="https://d2lvgg3v3hfg70.cloudfront.net/TB8195/.jpg" alt=" This stem-and-leaf plot
Q3: A particular advantage of a stem-and-leaf plot
Q4: Two statistics students are arguing over which
Q5: <img src="https://d2lvgg3v3hfg70.cloudfront.net/TB8195/.jpg" alt=" What data value
Q7: <img src="https://d2lvgg3v3hfg70.cloudfront.net/TB8195/.jpg" alt=" What is the
Q8: <img src="https://d2lvgg3v3hfg70.cloudfront.net/TB8195/.jpg" alt=" This stem-and-leaf plot
Q9: Relative frequency is best suited to describing
Q10: <img src="https://d2lvgg3v3hfg70.cloudfront.net/TB8195/.jpg" alt=" This stem-and-leaf plot
Q11: A student counted the number of candies