Multiple Choice
A professor of economics at a small Texas university wanted to determine what year in school students were taking his tough economics course. Shown below is a pie chart of the results. What percentage of the class took the course prior to reaching their senior year?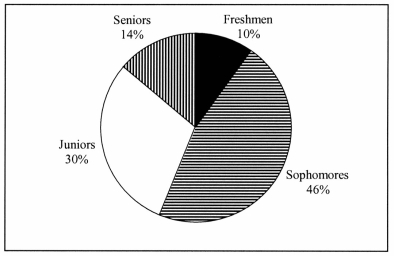
A) 14%
B) 44%
C) 54%
D) 86%
Correct Answer:

Verified
Correct Answer:
Verified
Q9: To determine the width of class interval,divide
Q15: TABLE 2-18<br>The stem-and-leaf display below shows the
Q24: TABLE 2-14<br>The table below contains the number
Q45: TABLE 2-17<br>The following table presents total retail
Q58: The main principle behind the Pareto chart
Q93: A_ is a vertical bar chart in
Q145: The larger the number of observations in
Q162: One of the advantages of a pie
Q168: When comparing two or more large sets
Q176: TABLE 2-17<br>The following table presents total retail