True/False
TABLE 2-17
The following table presents total retail sales in millions of dollars for the leading apparel companies during April 2009 and April 2010.
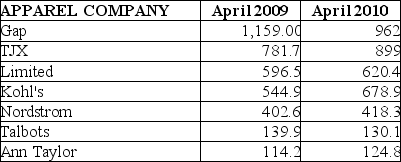
-Referring to Table 2-17, in general, retail sales for the apparel industry have seen a modest growth between April 2008 and April 2009.
Correct Answer:

Verified
Correct Answer:
Verified
Q40: TABLE 2-11<br>The ordered array below resulted from
Q41: TABLE 2-9<br>The frequency distribution below represents the
Q43: TABLE 2-9<br>The frequency distribution below represents the
Q44: TABLE 2-8<br>The Stem-and-Leaf display represents the number
Q47: TABLE 2-15<br>The figure below is the ogive
Q48: Given below is the scatter plot of
Q49: TABLE 2-10<br>The histogram below represents scores achieved
Q50: TABLE 2-13<br>Given below is the stem-and-leaf display
Q104: When constructing charts,the following is plotted at
Q161: In order to compare one large set