menu-iconExamlexExamLexServices

Discover

Ask a Question
  1. All Topics
  2. Topic
    Statistics
  3. Study Set
    Business Statistics
  4. Exam
    Exam 2: Organizing and Visualizing Data
  5. Question
    Given Below Is the Scatter Plot of the Number of Employees
Solved

Given Below Is the Scatter Plot of the Number of Employees

Question 119

Question 119

True/False

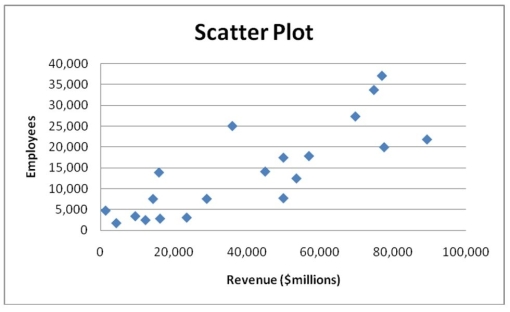
Given below is the scatter plot of the number of employees and the total revenue ($millions)of 20 U.S. companies. Companies that have higher numbers of employees appear to also have higher total revenue.

Correct Answer:

verifed

Verified

Unlock this answer now
Get Access to more Verified Answers free of charge

Related Questions

Q6: TABLE 2-5<br>The following are the duration in

Q14: TABLE 2-9<br>The frequency distribution below represents the

Q81: TABLE 2-12<br>The table below contains the opinions

Q116: Data on the number of part-time hours

Q123: TABLE 2-18<br>The stem-and-leaf display below shows the

Q140: The sum of cumulative frequencies in a

Q145: TABLE 2-13<br>Given below is the stem-and-leaf display

Q158: TABLE 2-12<br>The table below contains the opinions

Q184: TABLE 2-18<br>The stem-and-leaf display below shows the

Q196: TABLE 2-7<br>The Stem-and-Leaf display below contains data

Examlex

ExamLex

About UsContact UsPerks CenterHomeschoolingTest Prep

Work With Us

Campus RepresentativeInfluencers

Links

FaqPricingChrome Extension

Download The App

Get App StoreGet Google Play

Policies

Privacy PolicyTerms of ServiceHonor CodeCommunity Guidelines

Scan To Download

qr-code

Copyright © (2025) ExamLex LLC.

Privacy PolicyTerms Of ServiceHonor CodeCommunity Guidelines