Multiple Choice
Suppose that a typical household in the United States has an average after-tax income of $38,950. The circle graph below represents how this annual income is spent. (Note: It is because of rounding that the percents do not add up to 100%.) Approximately what amount is spent on clothing? 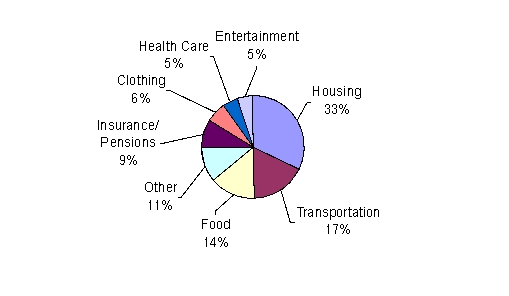
A) $233.70
B) $2337.00
C) $2.34
D) $36,613.00
E) $6491.67
Correct Answer:

Verified
Correct Answer:
Verified
Q33: The box-and-whiskers plot below shows the distribution
Q34: The circle graph shows a breakdown,
Q35: The bar graph shows the increasing life
Q36: The CDC reports that the average length
Q37: The pictograph below shows the approximate
Q39: An accounting major recorded the number
Q40: The bar graph below shows the
Q41: The resting heart rates for a group
Q42: The frequency polygon Figure shows the approximate
Q43: An accounting major recorded the number