Multiple Choice
The circle graph shows a breakdown, according to age, of the homeless in America. Use the graph. What percent of the homeless population is under the age of 54? 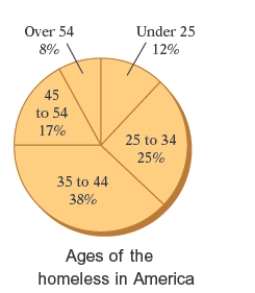
A) 89
B) 88
C) 95
D) 92
E) 96
Correct Answer:

Verified
Correct Answer:
Verified
Related Questions
Q29: A consumer research group purchased identical items
Q30: The frequency polygon below shows the distances
Q31: Three blue marbles, eight green marbles,
Q32: The times, in seconds, for a 100-meter
Q33: The box-and-whiskers plot below shows the distribution
Q35: The bar graph shows the increasing life
Q36: The CDC reports that the average length
Q37: The pictograph below shows the approximate
Q38: Suppose that a typical household in the
Q39: An accounting major recorded the number