Multiple Choice
The circle graph shows the budget allocation for the Griner family's income. The annual family income is $125,000. Find the amount of money budgeted annually for vehicle and housing and utilities. 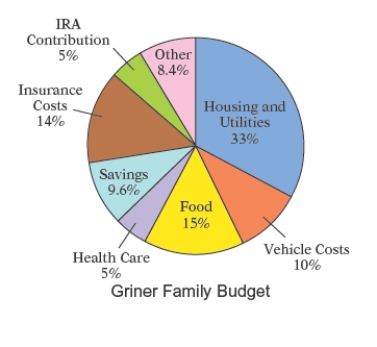
A) $53,850
B) $54,750
C) $52,750
D) $52,250
E) $53,750
Correct Answer:

Verified
Correct Answer:
Verified
Related Questions
Q6: The bar graph shows the increasing life
Q7: The heart rates of 24 women
Q8: The double-broken-line graph below shows the number
Q9: The circle graph shows the number of
Q10: The cholesterol levels for 100 adults
Q12: A consumer research group purchased identical items
Q13: The bar graph below shows the regions
Q14: The double-broken-line graph below shows the number
Q15: The annual tuition for undergraduate college students
Q16: The pictograph below shows the approximate